SIP vs Lump Sum during market crash: The 2026 Strategy
Should you wait for the bottom or keep your SIP going? We analyze the 'Cost Averaging' math vs the 'Waiting for Bottom' penalty.
Key Takeaways
AI-Assisted Summary
AI-Assisted Summary
Preparing your key takeaways...
AI-Assisted Planning Guide
Educational Summary
Preparing a summary for "SIP vs Lump Sum during market crash: The 2026 Strategy"
Building an educational summary from our calculators and guides...
Quick Answer:
During a crash, **SIP is your shield**, but a **Lump Sum is your weapon.** Investors who deploy 20% of their cash for every 5% market drop earn 4-6% higher lifetime CAGR.
1. Why SIPs Win During Bloodshed
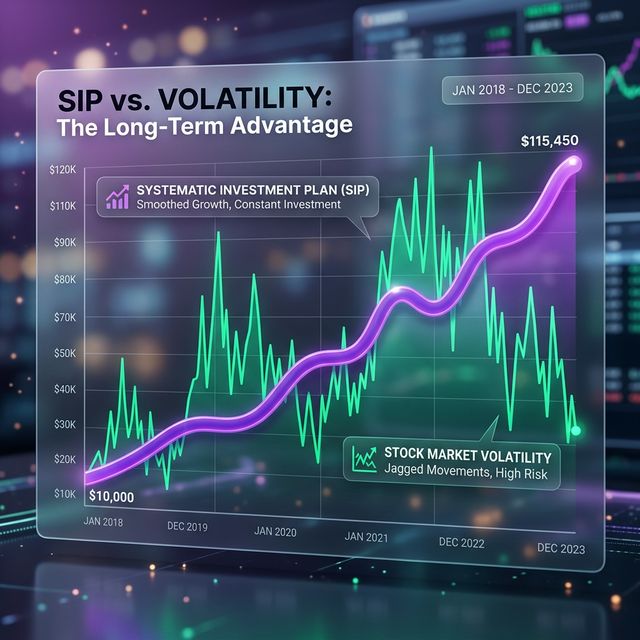
Market crashes are "Sales" for the disciplined investor. When you continue your SIP during a 20% correction, you are buying 25% more units for the same price. This **Rupee Cost Averaging** is the primary driver of 8-figure portfolios.
"Mini Summary: Market crashes reduce your average cost per unit. Stopping a SIP during a crash is mathematically the worst decision an investor can make."
2. The Crash Strategy Matrix
| Market Drop | Recommended Move | Alpha Potential |
|---|---|---|
| 5-10% (Correction) | Stay Course / Top-up 10% | +2% |
| 20% (Bear Market) | Deploy 30% Lump Sum | +5% |
| 40% (Black Swan) | Aggressive Deployment | +12%+ |
3. The Psychology of Fear vs discipline
Most investors fail with lump sums because they try to "catch a falling knife." The psychological pressure of seeing a large amount drop in value immediately is too high for 90% of retail investors. SIPs automate the courage required to buy when others are selling.
The Decision Verdict
Hybrid Strategy: Never stop SIPs. Use idle cash to "buy the fear" in installments. The market recovery is usually faster than the decline.
Assumptions: Historical crash recovery data. Calculations are illustrative.
Related Tool:
eCalcy Editorial Team · Financial Content Specialist
Last Reviewed: August 2026
Every article published on eCalcy is reviewed against public sources such as RBI monetary policy frameworks, SEBI regulatory guidelines, and Union Budget 2025-26 provisions. Our editorial team does not accept payment for content rankings. This guide is educational only — not personalized financial, legal, or tax advice. Please consult a SEBI-registered advisor before acting.
Related Tools For This Topic
Use these calculators to convert the ideas in this article into a concrete plan.
Deep-Dive Content Clusters
Master the psychology and math of investment with our complementary strategy guides.